
Somewhere on the label of almost every packaged food you’ve ever bought, there’s a small line that reads: “Based on a 2,000 calorie diet.”
It feels authoritative. Like a scientific anchor. Like this is the number.
It isn’t. The 2,000-calorie figure wasn’t calculated by researchers studying human metabolism — it was chosen in the early 1990s by the FDA as a convenient round number for food labeling standardization. When the Nutrition Labeling and Education Act of 1990 required manufacturers to print nutritional information on packaged foods, the FDA needed a single calorie benchmark against which to calculate “percent daily values” for fat, sodium, and other nutrients. The proposed figure was 2,350 calories, drawn from USDA dietary surveys — but FDA officials and public commenters pushed for something lower, reasoning that a higher number would encourage overconsumption. The final figure of 2,000 was selected because it was a round number easier for consumers to use, was less likely to imply false precision, and was considered appropriate for most women and some sedentary men. The result: a reduction of roughly 15 percent from the original proposal, and a benchmark that has lived on every food package for over three decades with almost nothing to do with what any specific individual actually needs.
Your real daily calorie intake depends on who you are. A 25-year-old male personal trainer and a 60-year-old retired teacher might both reach for the same cereal box, but their calorie needs could differ by well over 1,000 calories a day. What follows is how to close in on your actual number — without a laboratory or a dietitian’s appointment.
Why “2,000 Calories a Day” Isn’t Right for Everyone
Here is the actual history. The Nutrition Labeling and Education Act of 1990 required manufacturers to start printing nutritional information on packaged foods. To make those labels meaningful, the FDA needed a single calorie benchmark against which to calculate “percent daily values” for fat, sodium, and other nutrients.
The FDA initially proposed 2,350 calories, derived from USDA food consumption surveys showing men consumed roughly 2,000–3,000 calories daily and women 1,600–2,200. Public commenters — many of them nutritionists — pushed back, arguing that a higher reference value would signal that eating more was acceptable. The FDA ultimately settled on 2,000 for three documented reasons: it was a round number that implied less precision, a lower figure was more consistent with the public health goals of the Act, and 2,000 calories was considered appropriate for most women and some sedentary men.
No controlled trial. No metabolic testing. A bureaucratic compromise that became a cultural fact.
In practice, daily calorie needs across the adult population range from roughly 1,400 (a small, sedentary older woman) to well over 4,000 (a large, highly active young man). The label is a reference tool — and for most people, it is either meaningfully too low or too high.
The 5 Factors That Determine Your Calorie Needs
Forget the food label. Five variables determine where your actual number falls.
Age. A widely held belief says metabolism crashes after 30. The reality is more specific. A landmark 2021 study published in Science (Pontzer et al.) found that true resting metabolic rate remains remarkably stable between the ages of 20 and 60 — declining only 1–2% per decade during that window. What does change meaningfully is muscle mass. Adults naturally lose 3–8% of their skeletal muscle per decade after age 30, a process called sarcopenia. Because muscle is metabolically active tissue, this gradual loss effectively reduces the number of calories your body burns at rest — even if your diet, exercise routine, and body weight stay the same. For a 55-year-old with the same height, weight, and activity level as their 30-year-old self, that muscle loss typically translates to needing 100–200 fewer calories per day. The gap is real, but it’s driven by biology you can partly resist: consistent resistance training preserves muscle mass and protects your effective metabolic rate through the decades when it would otherwise quietly erode.
Sex. Men generally carry 10–15% more lean muscle mass than women of comparable height and weight. Because skeletal muscle burns approximately 13 kcal per kilogram per day at rest — compared to just 4.5 kcal per kilogram for fat tissue (Elia, 1992, as cited in Wang ZM et al., American Journal of Human Biology, 2011) — that structural difference, combined with men’s greater organ mass and overall lean tissue volume, typically translates to roughly 200–400 additional calories burned daily, even without any additional movement.
Height and weight. Larger bodies require more energy to sustain. A 90 kg person burns significantly more at rest than a 55 kg person of the same sex and age, simply because there is more tissue — organs, bone, muscle, skin — that needs to be kept alive. This is the most mechanical of the five factors: energy expenditure scales with body size.
Activity level. This is the biggest lever and the most commonly misjudged one. A sedentary person’s total daily energy needs sit at roughly 1.2× their basal metabolic rate. A very active person operates at closer to 1.725×. That gap can represent 700 to 1,000 calories per day between two people of identical build. What most estimates miss is the role of non-exercise activity thermogenesis (NEAT) — the calories burned through all movement that isn’t formal exercise: walking to the car, standing while on a phone call, fidgeting, taking stairs. Research suggests NEAT alone can vary by up to 2,000 calories per day between individuals of similar body weight. It is the hidden variable that explains why two people doing the same gym sessions can have dramatically different maintenance calorie needs.
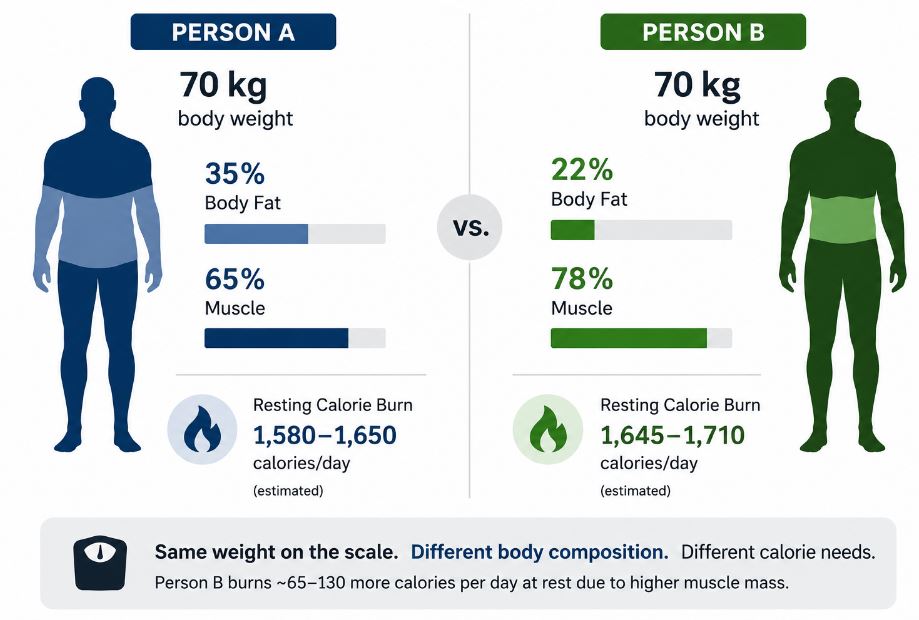
Body composition. Two people at identical scale weights can have meaningfully different calorie needs if their muscle-to-fat ratios differ. A 70 kg woman carrying 22% body fat will burn measurably more calories at rest than a 70 kg woman carrying 35% body fat, even at the same height, age, and activity level. The metabolic advantage of muscle tissue is real but modest in absolute terms — gaining 5 kg of muscle adds roughly 65 calories to your daily resting burn. The more important effect plays out over years: greater muscle mass provides a metabolic buffer against the gradual calorie creep that comes with age-related muscle loss.
General Calorie Ranges by Age and Sex
These estimates come directly from the Dietary Guidelines for Americans 2020–2025 (USDA/HHS, 9th Edition) and reflect three activity levels: sedentary (light daily activity only), moderately active (equivalent to walking approximately 1.5–3 miles per day on top of usual daily life), and active (more than 3 miles per day in addition to regular daily activities).
| Group | Sedentary | Moderately Active | Active |
|---|---|---|---|
| Women 19–30 | ~1,800 | ~2,000 | ~2,400 |
| Women 31–50 | ~1,800 | ~2,000 | ~2,200 |
| Women 51+ | ~1,600 | ~1,800 | ~2,100 |
| Men 19–30 | ~2,400 | ~2,600–2,800 | ~3,000 |
| Men 31–50 | ~2,200 | ~2,400–2,600 | ~2,800–3,000 |
| Men 51+ | ~2,000 | ~2,200–2,400 | ~2,600–2,800 |
Use these as a starting range, not a final number. Your height and body composition will push you above or below these estimates, and the activity categories are deliberately broad. A 6’2″ man and a 5’5″ man in the same age and activity bracket can differ by several hundred calories at maintenance.
A Quick Way to Estimate Your Personal Calorie Needs
If you want a faster method than the full formula, multiply your body weight in kilograms by an activity factor:
| Activity Level | Calculation |
|---|---|
| Sedentary | Body weight (kg) × 26–28 |
| Lightly active | Body weight (kg) × 30–32 |
| Moderately active | Body weight (kg) × 33–35 |
| Very active | Body weight (kg) × 36–40 |
Example: A moderately active 70 kg woman → 70 × 34 = 2,380 calories per day for maintenance.
This method works well as a quick sanity check, but it doesn’t account for sex, age, or body composition — three factors the framework above shows to be significant. For a more accurate figure, the Mifflin-St Jeor equation is the current clinical benchmark. A 2005 systematic review in the Journal of the American Dietetic Association (Frankenfield et al.) tested all major BMR prediction equations against indirect calorimetry measurements and found Mifflin-St Jeor predicted resting metabolic rate within ±10% of directly measured values in more healthy adults than any competing formula:
Men: BMR = (10 × weight in kg) + (6.25 × height in cm) − (5 × age in years) + 5
Women: BMR = (10 × weight in kg) + (6.25 × height in cm) − (5 × age in years) − 161
Multiply that result by your activity factor (1.2 for sedentary; 1.375 for lightly active; 1.55 for moderately active; 1.725 for very active) to get your Total Daily Energy Expenditure (TDEE) — the actual maintenance number you’re looking for.
One important caveat: ±10% accuracy at the individual level can mean a difference of 150–250 calories in either direction from your true expenditure. No formula removes this uncertainty. That’s why tracking your real weight trend for two to four weeks is best. It works better than trusting any single calculation. This is the only way to confirm your estimate is correctly calibrated.
Adjusting Calories for Your Specific Goal
Once you have a TDEE estimate, the adjustments are straightforward — even if the execution takes patience.
To maintain weight: Eat at your estimated TDEE. Expect daily scale fluctuations of up to 1–2 kg from water retention, food volume, and hormonal shifts. A single high-sodium meal can add more than 1 kg of water weight by the next morning — not fat, just water. What matters is the average trend over two to four weeks, not the number on any given morning.
To lose fat: Eat 300–500 calories below TDEE. This produces roughly 0.3–0.5 kg of actual fat loss per week — slow enough to preserve muscle and fast enough to see measurable progress. Larger deficits often backfire: cutting too deep triggers metabolic adaptation and intensifies hunger to a level that makes the deficit unsustainable long-term. The goal is the smallest deficit that produces consistent, observable progress over time.
To build muscle: Eat 200–300 calories above TDEE, prioritize protein (at least 1.6 g per kg of body weight daily), and follow a progressive resistance training program. Without a consistent training stimulus, a calorie surplus produces fat gain, not muscle. The surplus is only productive when the body has a clear physiological reason to use the extra energy for tissue synthesis.
Track your weight weekly for three to four weeks before deciding whether your initial estimate is accurate. The formula is the starting point. Your body’s response over time is the final calibration tool.
Signs You’re Eating Too Few Calories
Reducing daily calorie intake is one of the most reliable tools for managing body weight — right up until intake drops too low for too long. When calorie supply falls too far below what the body requires, it responds with a coordinated set of physiological changes designed to protect it. Thyroid hormone levels decline, leptin (the satiety hormone) drops, ghrelin (the hunger hormone) rises, and resting metabolic rate decreases. The body doesn’t distinguish between deliberate dieting and famine — it simply responds to the energy deficit signal. Here are the most common signs that your intake has dropped too low:
Constant, distracting hunger. Mild hunger is a normal and expected part of any calorie deficit. Severe, relentless hunger that dominates your attention throughout the day is a different signal — it indicates the deficit is too steep, not that your willpower is insufficient. Hunger at this intensity is a physiological response, not a character flaw.
Fatigue that doesn’t resolve with rest. When energy intake is chronically below what the body requires, the body reduces its output to match. Persistent exhaustion despite adequate sleep — particularly if it accumulates over weeks rather than appearing occasionally after hard training — is a common early marker of sustained underfueling.
Weight loss stalling despite eating very little. This is metabolic adaptation. The body has progressively reduced its own calorie burn to approach the level of intake being provided. The plateau isn’t a mystery or a sign that nothing works — it’s the body doing exactly what it evolved to do in response to a prolonged energy shortage.
Declining gym performance. If strength or endurance is consistently falling despite normal sleep and recovery, insufficient calorie or protein intake is the most likely cause. The body begins catabolizing muscle for fuel when dietary energy is insufficient — and this shows up as reduced performance before it appears on the scale.
Hair loss or brittle nails. These signals typically appear after several weeks of sustained restriction and indicate both micronutrient deficiency and overall calorie shortfall. Hair loss in particular (clinically known as telogen effluvium) is triggered by the physiological stress of inadequate nutrition and often lags the period of restriction by two to three months, making it easy to misattribute.
The most widely cited minimum intake levels in clinical nutrition are 1,200 calories per day for women. For men, the level is 1,500 calories per day. These are the lowest limits for meeting daily micronutrient needs through food alone. This is based on guidance from groups like the American Heart Association. Consistently eating below these figures increases risk of nutrient deficiency, bone density loss, and muscle breakdown — all of which slow long-term progress, not accelerate it. If you’re near or below these numbers without seeing results, working with a registered dietitian is worth the investment.
Finding Your Real Number
Your daily calorie needs are personal — shaped by your age, sex, size, how much you move, and how much of your body weight is muscle versus fat. The 2,000-calorie figure on your cereal box was never designed to answer that question. It was a practical compromise made during regulatory rulemaking in the early 1990s, optimized for labeling math and public health messaging rather than individual metabolic accuracy.
Start with the ranges and formulas above. Track your intake and your actual weight trend for two to four weeks, and let the results tell you whether your estimate needs adjusting. Weight management becomes significantly more tractable — and considerably less confusing — once you’re working from a real, personalized baseline rather than a number that was never meant to apply to you specifically.
Next step: Once you know your maintenance number, the natural question is how to calculate a deficit that actually holds. This four-step method covers the calculation from scratch — including how to calibrate the result using your first two weeks of real tracking data.
Last updated: June 2026 | Reviewed against Dietary Guidelines for Americans 2020–2025 (USDA/HHS)
References
- Mifflin MD, St Jeor ST, Hill LA, Scott BJ, Daugherty SA, Koh YO. “A new equation to predict resting energy use in healthy people.” American Journal of Clinical Nutrition. 1990;51(2):241–7.
- Frankenfield D, Roth-Yousey L, Compher C. “Comparison of predictive equations for resting metabolic rate in healthy nonobese and obese adults: a systematic review.” Journal of the American Dietetic Association. 2005;105(5):775–89.
- Elia M. “Organ and tissue contribution to metabolic rate.” In: Kinney JM, Tucker HN, editors. Energy Metabolism: Tissue Determinants and Cellular Corollaries. New York, NY: Raven Press; 1992:61–80.
- Wang ZM, Zhang JJ, Ying Z, Heymsfield SB. “Evaluation of specific metabolic rates of major organs and tissues: comparison between men and women.” American Journal of Human Biology. 2011;23(3):333–8.
- Pontzer H, et al. “Daily energy expenditure through the human life course.” Science. 2021;373(6556):808–812.
- Dietary Guidelines for Americans 2020–2025, 9th Edition. U.S. Department of Agriculture and U.S. Department of Health and Human Services. December 2020.
- National Academies of Sciences. Dietary Reference Intakes: Guiding Principles for Nutrition Labeling and Fortification. Available at: ncbi.nlm.nih.gov/books/NBK208887. [Cited for FDA 2,000-calorie benchmark rationale.]
Pingback: Low Calorie Foods for Weight Loss: Full 2026 Guide
Pingback: Not Losing Weight on a Calorie Deficit? 7 Common Reasons