How to Count Macros for Weight Loss: A Step-by-Step Guide
Last updated: July 3, 2026. Fact-checked and reviewed against peer-reviewed nutrition research, including the Longland et al. (2016) randomized controlled […]
Last updated: July 3, 2026. Fact-checked and reviewed against peer-reviewed nutrition research, including the Longland et al. (2016) randomized controlled […]
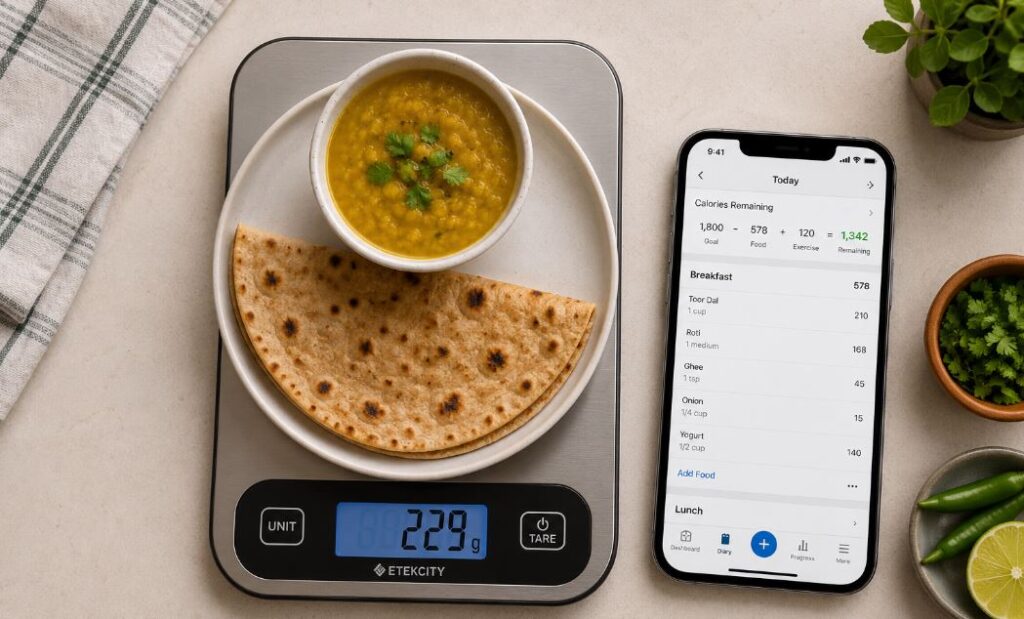
Table of Contents If you’ve ever typed “how do you actually count calories” into Google and then quietly deleted it
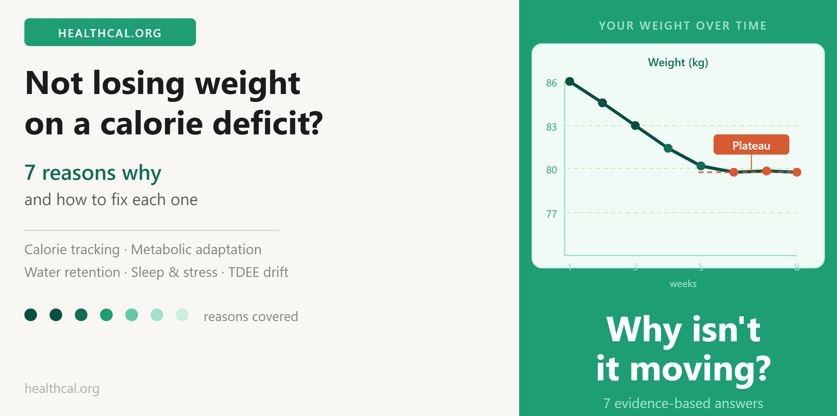
You’re tracking every meal. Weighing your portions. Hitting your numbers week after week. And the scale hasn’t moved in over

Put 100 grams of crisps on a kitchen scale. Now put 100 grams of sliced cucumber next to them. They
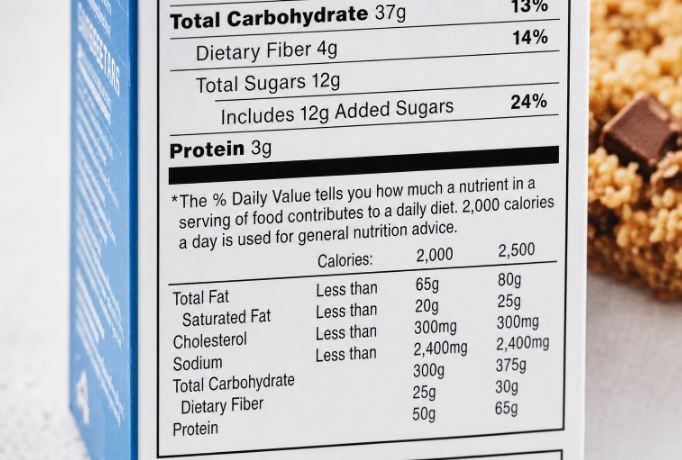
Somewhere on the label of almost every packaged food you’ve ever bought, there’s a small line that reads: “Based on
You can eat chicken and broccoli every day and still not lose weight. If your calorie intake isn’t below your
Last updated: June 21, 2026 Your doctor’s scale spits out a BMI of 27.8 and labels you “overweight.” Meanwhile your
Why Belly Size Predicts Your Health Risk Better Than Scale Weight Your scale weight tells you one thing. Your waist
What Your Weight Means for Your Blood Sugar Risk More than 537 million adults worldwide currently live with type 2
How Poor Sleep Wrecks Your Weight (And What the Research Proves Works) Most people trying to manage their weight focus