
Last updated: June 21, 2026
Your doctor’s scale spits out a BMI of 27.8 and labels you “overweight.” Meanwhile your friend, who can barely close her fist around a barbell, gets the exact same number. That’s the forty-year-old flaw at the center of body mass index, and it’s why a 2024 study on something called the Body Roundness Index made headlines from ABC News to the Yale Medicine newsroom.
BRI doesn’t ask how much you weigh. It asks how round you are — using just your height and your waist. That sounds gimmicky until you look at the math behind it and the mortality data tied to it. This guide walks through the actual formula (with three worked examples you can follow by hand), the real numbers from the headline JAMA study, and the parts of the BRI story that most coverage glosses over — including the fact that it’s mathematically closer to an old, simpler metric than its “breakthrough” framing suggests.
By the end, you’ll be able to calculate your own BRI without an app, read the result correctly, and know exactly where the evidence is strong and where it’s still thin.
Table of Contents
- What Is the Body Roundness Index?
- How to Calculate BRI: The Formula, Step by Step
- Three Worked Examples
- BRI Score Chart: What Counts as Healthy
- The 2024 JAMA Study: What It Actually Found
- BRI vs. BMI vs. Waist-to-Height Ratio: The Honest Comparison
- Why BMI Misses Muscle — and BRI Mostly Doesn’t
- What BRI Gets Wrong
- Who Shouldn’t Rely on BRI Alone
- How to Measure Your Waist Correctly
- FAQ
What Is the Body Roundness Index?
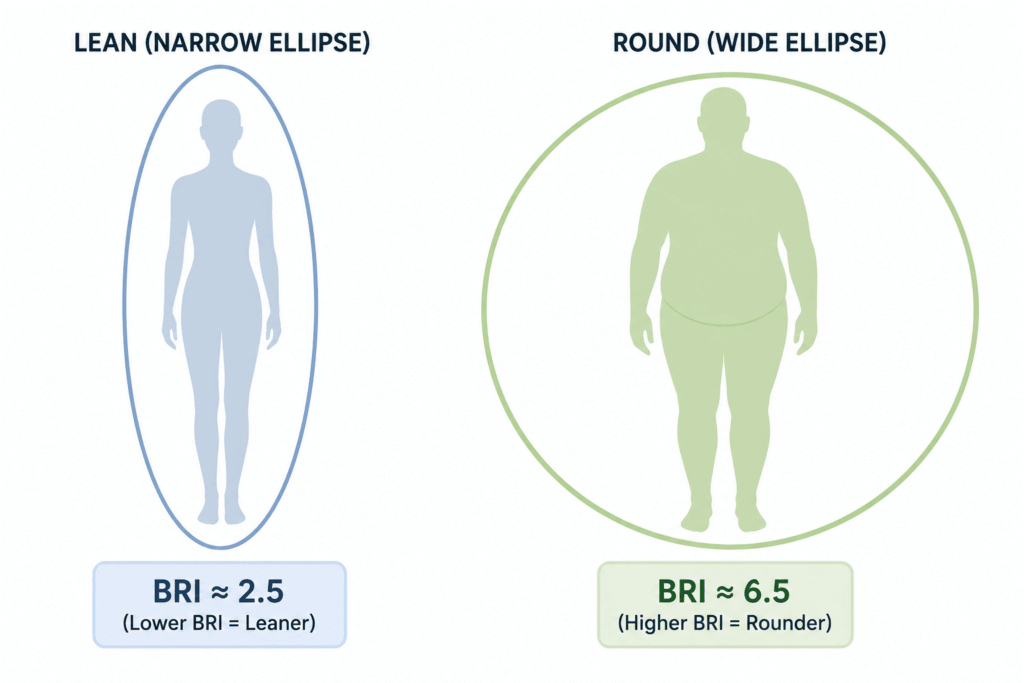
BRI was introduced in 2013 by Diana Thomas, a mathematician then at the United States Military Academy at West Point, working with a team that wanted a better geometric model of the human body than BMI’s flat height-and-weight calculation. Instead of treating your body as a uniform cylinder, Thomas modeled it as a vertical ellipse — picture an egg standing on its end, with your height as the long axis and your waist as the short one.
The math behind that ellipse is “eccentricity,” a value between 0 and 1 that describes how circular the shape is. A perfect circle (waist as wide as you are tall — which never happens in practice) would score close to 1. A flat line would score 0. Thomas’s team rescaled eccentricity into a more intuitive number ranging from roughly 1 to 20, where higher numbers mean a rounder midsection.
The original model was validated against DXA and MRI scans pulled from NHANES, the CDC’s long-running national health survey, which is part of why BRI re-entered the news in 2024: a new analysis ran that same NHANES dataset forward to see whether BRI actually predicted who lived and who didn’t.
How to Calculate BRI: The Formula, Step by Step
You need exactly two measurements: your height and your waist circumference, in the same unit (both in inches or both in centimeters). That’s it. No scale, no hip measurement, no skinfold calipers.
The official formula, as published by Thomas and colleagues, is:
BRI = 364.2 − 365.5 × √(1 − (waist ÷ height ÷ π)²)
Broken into three steps, it’s much easier to follow:
- Find your waist-to-height ratio (WHtR): waist ÷ height
- Find the eccentricity (e): √(1 − (WHtR ÷ π)²)
- Calculate BRI: 364.2 − (365.5 × e)
Watch Out: Several popular online BRI calculators ask for your hip circumference in addition to waist and height. The peer-reviewed Thomas formula doesn’t use hip measurement at all — that’s a feature borrowed from waist-to-hip ratio, a completely different metric. If a “BRI calculator” wants your hips, it’s either calculating something else or padding its own data collection. One calculator site we reviewed publicly admitted to publishing an incorrect formula and had to issue a correction. Stick to the three-step formula above and you’ll never need a hip measurement.
Three Worked Examples
Numbers make this concrete faster than prose does. Here are three real calculations, done by hand, all using a 5’6″ (66-inch) frame so you can see exactly how much waist size — not weight — moves the score.
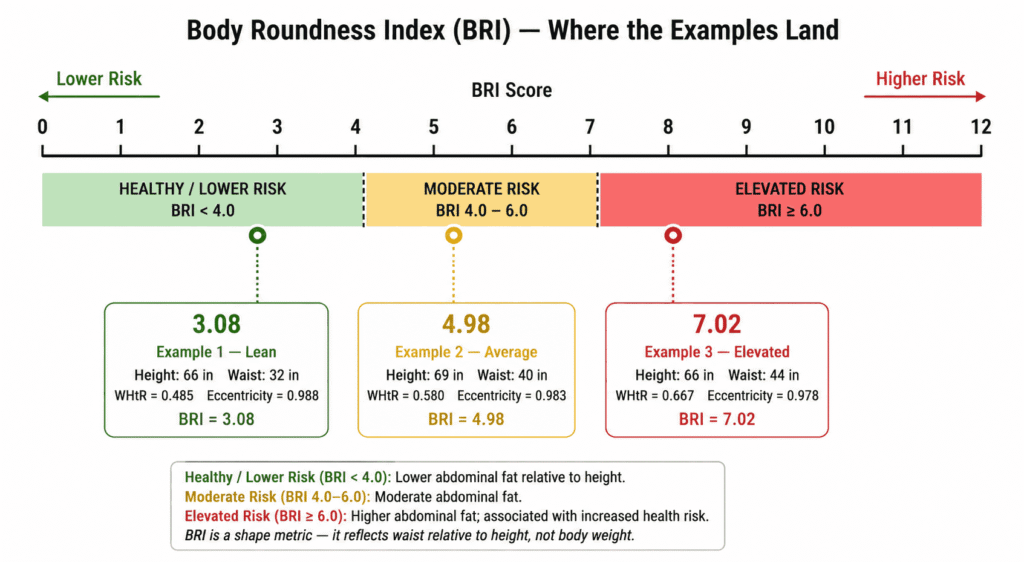
Example 1 — Lean: Height 66 in, waist 32 in.
WHtR = 32 ÷ 66 = 0.485. Eccentricity = 0.988. BRI = 364.2 − (365.5 × 0.988) = 3.08.
Example 2 — Average: Height 69 in, waist 40 in.
WHtR = 40 ÷ 69 = 0.580. Eccentricity = 0.983. BRI = 364.2 − (365.5 × 0.983) = 4.98.
Example 3 — Elevated: Height 66 in, waist 44 in.
WHtR = 44 ÷ 66 = 0.667. Eccentricity = 0.978. BRI = 364.2 − (365.5 × 0.978) = 7.02.
Notice that a 12-inch difference in waist size at the same height (Examples 1 and 3) swings the score from “lean” to “elevated risk” — while two people of completely different heights and weights (Examples 1 and 2) can land close together if their proportions are similar. That’s the entire point of the metric: it’s tracking shape, not size.
BRI Score Chart: What Counts as Healthy?
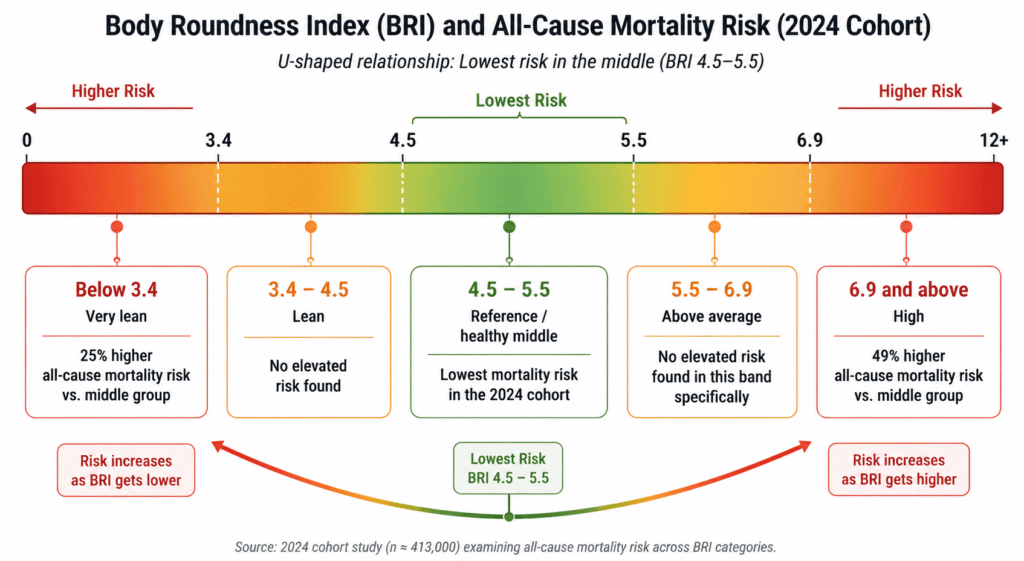
The only thresholds with actual mortality data behind them come from the 2024 JAMA Network Open cohort study, which compared a low-BRI group, a high-BRI group, and a healthy middle reference group of adults.
A few consumer calculator sites publish slightly different cutoffs (3.41, 4.45, 5.46, 6.91) framed as population percentiles rather than risk bands. Those numbers come from where people happen to fall on a bell curve, not from a study linking them to outcomes — worth knowing before you treat a calculator’s color-coded verdict as medical fact.
The 2024 JAMA Study: What It Actually Found
This is the study every BRI article cites, so it’s worth reading past the headline. Researchers led by Xiaoqian Zhang pulled height, waist, and mortality records for 32,995 U.S. adults aged 20 and older from NHANES surveys conducted between 1999 and 2018, then linked those records to mortality data through the end of 2019 — a median follow-up of close to a decade. The study ran in JAMA Network Open in June 2024.
Two findings came out of it. First, the average American’s BRI climbed steadily over those two decades, from about 4.8 to 5.6 — roughly a 1% increase every two years, with the increase steepest among women, adults over 65, and Mexican American participants. That’s a population-level echo of the broader obesity trend, not new information on its own.
Key Stat: The mortality finding is the one that matters. Compared with adults in the healthy middle range (BRI 4.5–5.5), people with a BRI under 3.4 had a 25% higher risk of dying from any cause during the study period (hazard ratio 1.25). People with a BRI of 6.9 or higher had a 49% higher risk (hazard ratio 1.49). Plotted on a graph, risk doesn’t rise in a straight line — it dips at the bottom of the range and then climbs sharply at both ends, forming a U-shape.
That U-shape is the genuinely interesting part, and it’s the detail most aggregator articles compress into “higher BRI is bad.” It isn’t just that — being unusually narrow-bodied for your height carried its own elevated mortality risk in this dataset, likely reflecting frailty, illness-related weight loss, or low muscle mass rather than anything protective about extreme leanness. The researchers also reran the analysis after excluding accidental deaths and deaths within the first two years of follow-up, specifically to rule out reverse causation — the possibility that people were already sick and losing weight before the study started skewing the low-BRI numbers. The U-shaped pattern held up.
What this study did not do is prove that a high or low BRI causes early death, or that changing your BRI changes your risk. It’s an observational cohort study: it shows an association in one country’s population over one twenty-year window. The authors themselves flagged that the findings need replication in other populations before BRI gets treated as a clinical standard — a caveat that’s easy to miss when a headline reads “New Index Beats BMI.”
BRI vs. BMI vs. Waist-to-Height Ratio: The Honest Comparison
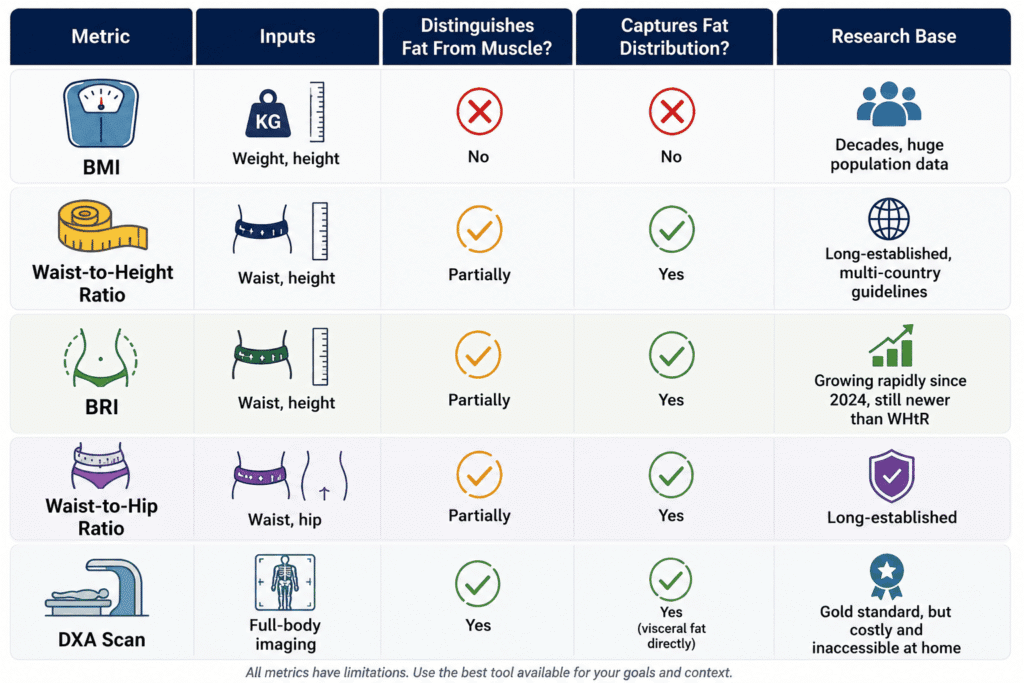
Here’s the comparison almost no BRI explainer makes, and it’s the single most useful thing to understand before you get attached to your score: mathematically, BRI is a transformation of waist-to-height ratio (WHtR). Look at the formula again — the only two inputs are waist and height, fed through the exact same ratio (waist ÷ height) that WHtR uses directly. BRI just runs that ratio through an ellipse equation and rescales it onto a 1-to-20 scale instead of leaving it as a simple decimal.
That doesn’t make BRI useless. The ellipse transformation does change how the numbers are distributed, and validation studies have found BRI correlates strongly with both total body fat and visceral fat measured by DXA scans. But waist-to-height ratio has been studied for longer, in more populations, and several national health bodies already recommend a WHtR cutoff (commonly 0.5) as a simpler “early warning” guideline. If you’ve never heard that BRI’s core ingredient is a metric you can calculate by dividing two numbers, that’s a gap in how this topic usually gets covered — not a reason to dismiss BRI, but a reason to hold the “all-new breakthrough” framing loosely.
Why BMI Misses Muscle — and BRI Mostly Doesn’t
The clearest illustration of BMI’s blind spot is a bodybuilder, and the example that’s circulated through Yale Medicine’s own commentary on this topic is almost too perfect: at his competitive peak, Arnold Schwarzenegger stood 6’2″ and weighed roughly 235 pounds, putting his BMI at 30.2 — clinically “obese.” His waist, however, measured under 34 inches, which works out to a BRI around 2.6: “very lean” on the same chart that flags people at 6.9 and above.
That gap exists because BMI can’t tell the difference between 40 pounds of muscle across your shoulders and back and 40 pounds of fat around your middle — both register as the same number on the scale relative to your height. BRI, by only measuring the waist, sidesteps that specific failure mode. It’s not a perfect fix for everyone (see the limitations below), but for the single most common real-world complaint about BMI — “this number doesn’t see my muscle” — BRI genuinely performs better.
For most people who aren’t carrying unusual amounts of muscle mass, registered dietitians note that BMI and BRI tend to land in similar territory anyway. The divide only becomes meaningful at the extremes: very muscular bodies, very lean bodies with low muscle mass, or bodies carrying weight in a way that BMI’s simple ratio was never built to detect.
What BRI Gets Wrong
No metric calculated from two tape-measure readings can fully capture human health, and BRI has specific weak spots worth naming honestly.
- It still can’t see what’s under the skin. BRI estimates visceral fat; it doesn’t measure it. Someone with ascites (fluid buildup in the abdomen), a recent abdominal surgery, or simply a naturally wider pelvic structure will register a higher BRI without having more dangerous fat.
- The research base is thinner than BMI’s. BMI has been studied across populations for the better part of a century. BRI has only existed since 2013, and most of the large mortality data behind it comes from one country’s dataset. Studies in Chinese, Iranian, and other populations have sometimes found BRI performs about as well as BMI or waist circumference — not consistently better — depending on the outcome being measured.
- Accurate measurement takes practice. A waist measurement taken an inch too high or too low, or pulled too tight, shifts the result meaningfully. Clinicians need training to measure consistently, and a single home measurement is far noisier than a clinical one.
- The framing itself raises concerns. A registered dietitian quoted by ABC News pointed out that BRI’s design tends to favor slender body types by definition, which risks reinforcing the idea that a rounder body is automatically an unhealthy one — even though body shape alone doesn’t determine someone’s health status.
- It hasn’t been adopted into clinical guidelines. As of mid-2026, BMI remains the default screening tool used by physicians and insurers. BRI shows up in research papers and consumer wellness tools far more often than it shows up on a chart in your doctor’s office.
Who Shouldn’t Rely on BRI Alone
A handful of groups should treat any BRI result as, at best, a starting conversation rather than a verdict:
- Pregnant people, whose waist measurements change for reasons that have nothing to do with fat distribution.
- Children and teenagers — pediatric BRI research is real and growing, but the adult thresholds in this article don’t apply to anyone under 20, and age- and sex-specific pediatric reference ranges are still being established.
- People recovering from abdominal surgery or living with conditions that cause bloating or fluid retention, since these can inflate waist measurements independent of fat.
- Very muscular or very tall/short individuals, who fall outside the body proportions the original ellipse model was built and tested on.
If you fall into any of these groups, a conversation with a clinician about body composition will tell you far more than any tape-measure formula.
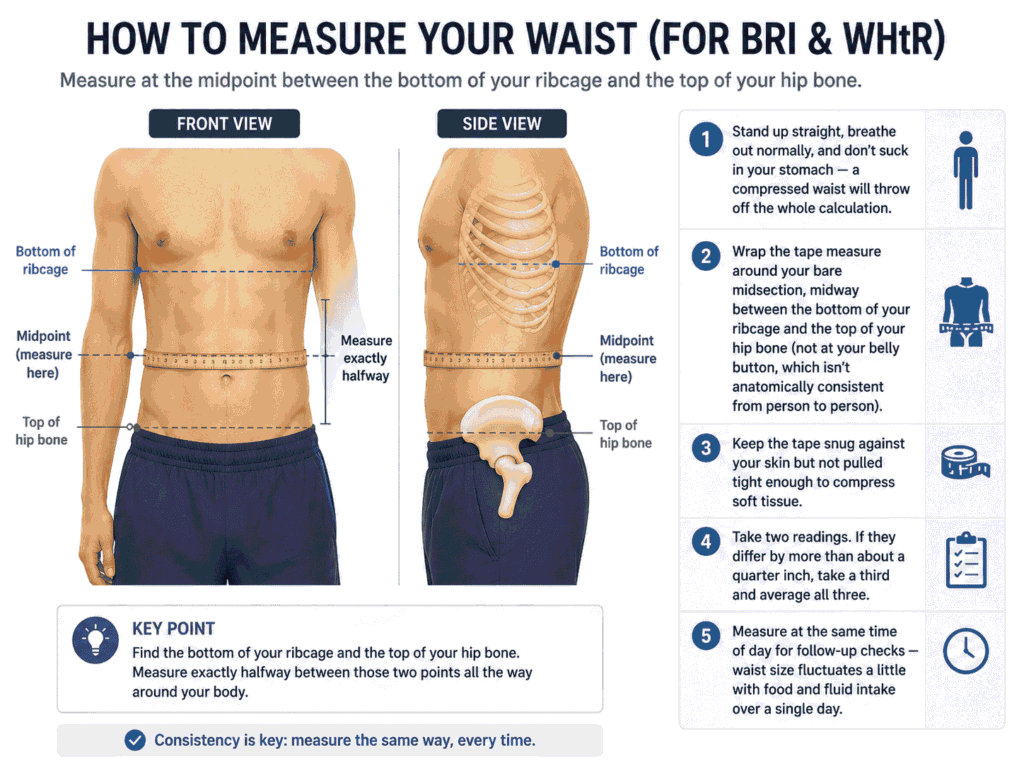
How to Measure Your Waist Correctly
Getting this measurement right matters more for BRI than it does for almost any other home health metric, since the entire score rests on one number.
- Stand up straight, breathe out normally, and don’t suck in your stomach — a compressed waist will throw off the whole calculation.
- Wrap the tape measure around your bare midsection, midway between the bottom of your ribcage and the top of your hip bone (not at your belly button, which isn’t anatomically consistent from person to person).
- Keep the tape snug against your skin but not pulled tight enough to compress soft tissue.
- Take two readings. If they differ by more than about a quarter inch, take a third and average all three.
- Measure at the same time of day for follow-up checks — waist size fluctuates a little with food and fluid intake over a single day.
FAQ
Is BRI more accurate than BMI?
For predicting all-cause mortality in the 2024 NHANES cohort, yes — BRI showed a clearer U-shaped risk pattern than BMI typically shows. For other outcomes and other populations, the evidence is mixed: some studies show BRI outperforming BMI for diabetes or cardiovascular risk, others find it performs about the same as waist circumference alone.
What is a good BRI score?
Based on the 2024 study’s reference group, a BRI between 4.5 and 5.5 carried the lowest measured mortality risk. That said, “good” varies somewhat with age, sex, and ethnicity, and the thresholds above come from a U.S. population — they haven’t been independently validated worldwide yet.
Can I calculate BRI without an online calculator?
Yes — the three-step formula in this article uses only a calculator with a square-root function (or any spreadsheet) and two measurements. No app or account is required.
Do doctors actually use BRI?
Not routinely, as of 2026. It shows up extensively in research literature and in consumer wellness apps, but BMI remains the standard screening number used in most clinical settings and insurance underwriting.
Why do some BRI calculators ask for hip measurement?
They’re either using a different formula than the one Thomas and colleagues published, or borrowing an input from waist-to-hip ratio. The validated BRI formula needs only waist circumference and height.
Is a high BRI the same as being unhealthy?
No. BRI estimates one risk factor — central fat distribution — associated with population-level mortality risk. It doesn’t account for fitness, blood pressure, blood sugar, family history, or dozens of other factors that matter more for any one individual’s actual health.
The Bottom Line
BRI isn’t a magic replacement for BMI, and it isn’t the over-hyped fad some skeptics make it out to be either. It’s a more shape-aware metric, built on real geometry, with one solid mortality study behind its current reputation and a research base that’s still catching up to BMI’s decades-long head start. Calculate it, read your number against the JAMA-backed thresholds rather than a calculator site’s marketing copy, and treat it as one data point — alongside waist circumference, how your clothes fit, and an actual conversation with a doctor if your number sits at either extreme.
Grab a tape measure, run the three-step formula above, and see where you land. If your result surprises you, that’s a good reason to bring it up at your next physical — not a reason to panic over a number calculated from two measurements and a square root.
About the data: This article draws on the peer-reviewed Thomas et al. (2013) origin paper in Obesity, the Zhang et al. (2024) cohort study in JAMA Network Open, and reporting from Yale Medicine, ABC News, and Nebraska Medicine. All statistics are dated to their original publication; the core mortality data is from 2024 and reflects NHANES survey years 1999–2018.
Sources:
- Thomas, D.M., et al. “Relationships Between Body Roundness With Body Fat and Visceral Adipose Tissue Emerging From a New Geometrical Model.” Obesity, 2013.
- Zhang, X., Ma, N., Lin, Q., et al. “Body Roundness Index and All-Cause Mortality Among US Adults.” JAMA Network Open, 2024;7(6):e2415051.
- Yale Medicine, “BMI or BRI? How to Assess Your Body Weight,” 2024.
- ABC News, “What to Know About Body Roundness Index, an Alternative to BMI,” 2024.
Pingback: How to Calculate Your Calorie Deficit (Step-by-Step Formula)