
Your number means something different on a woman’s body than it does on a man’s. The formula is identical — but the biology behind it is not.
This page explains what your BMI result actually means for you: how hormones shift your body composition across your life, why the standard thresholds need context for women, what your number tells you at 25 versus 45 versus 65, and what to do next.
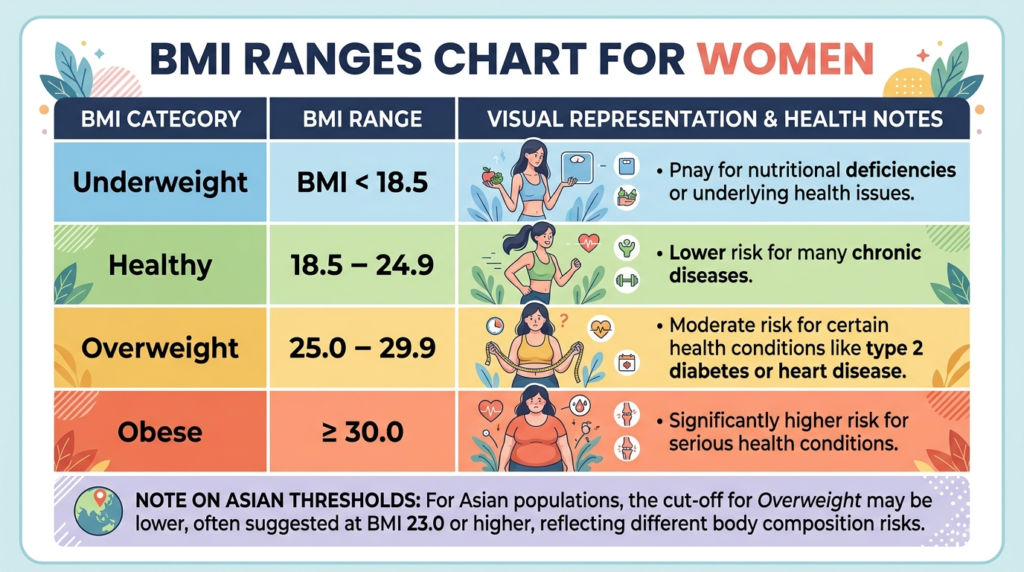
Table of Contents
- What Is a Healthy BMI for Women?
- BMI Ranges for Women — Full Table
- Why BMI Works Differently on a Woman’s Body
- BMI for Women by Age Group
- The Limitation Most Women Hit After 40
- What to Do With Your Result
- Frequently Asked Questions
What Is a Healthy BMI for Women?
For adult women aged 20 and over, the standard healthy BMI range is 18.5 to 24.9 — the same threshold that applies to men. The World Health Organization (WHO) and the Centers for Disease Control and Prevention (CDC) both use this range across all adult genders.
But here is what those organisations also acknowledge: the same BMI number does not represent the same body composition in a woman as it does in a man. Research published in Frontiers in Endocrinology (2022) found that women carry 10 to 20 percent more body fat than men at the same BMI — a difference driven primarily by oestrogen, which directs fat storage to the hips, thighs, and buttocks rather than the abdomen. That fat, known as subcutaneous fat, is metabolically different from the visceral fat that accumulates around the organs — and generally carries lower cardiovascular risk.
The practical implication: a woman with a BMI of 26 is not in the same metabolic position as a man with a BMI of 26, even though the number looks identical. BMI is a useful starting point for women — but it needs more context than the number alone provides.
BMI Ranges for Women — Full Table
The standard adult categories apply to women aged 20 and over:
| BMI Range | Category | What It Suggests |
|---|---|---|
| Below 18.5 | Underweight | Risk of bone density loss, hormonal disruption, immune issues |
| 18.5 – 24.9 | Healthy Weight | Lowest overall disease risk for most women |
| 25.0 – 29.9 | Overweight | Mildly elevated risk of Type 2 diabetes, high blood pressure |
| 30.0 – 34.9 | Obese — Class I | Elevated cardiovascular, metabolic, and cancer risk |
| 35.0 – 39.9 | Obese — Class II | High risk across multiple conditions |
| 40.0 and above | Obese — Class III | Highest risk — qualifies for clinical intervention |
Source: CDC Adult BMI Categories (June 2024); WHO Obesity Classification.
For women of Asian descent: The WHO recommends lower thresholds for East and South Asian populations — overweight begins at BMI 23 (not 25), and obesity at 27.5 (not 30). Metabolic risk, including risk of Type 2 diabetes and cardiovascular disease, has consistently been shown to rise at lower BMI values in these groups. If this applies to you, use the adjusted thresholds when interpreting your result.
Healthy body fat range for women: Baylor College of Medicine defines a healthy body fat percentage as 25–31% for women (compared to 18–24% for men). A woman with a BMI of 22 may have a body fat percentage anywhere from 22% to 33% depending on her muscle mass, age, and ethnicity. This is precisely why BMI alone tells an incomplete story.
Why BMI Works Differently on a Woman’s Body
The BMI formula does not change for women — but the biological context around the number does.
Oestrogen and fat storage
Oestrogen, the primary female sex hormone, directly influences where and how fat is stored. A University of New South Wales research review established that oestrogen drives fat storage in the gluteofemoral region — hips, thighs, and buttocks — for reproductive purposes. This fat is subcutaneous, not visceral. It sits under the skin rather than around the organs.
This matters because subcutaneous fat and visceral fat have fundamentally different metabolic effects. Subcutaneous fat — the type women predominantly carry in their reproductive years — is associated with lower cardiovascular risk than the abdominal visceral fat that men tend to accumulate at the same BMI.
The consequence: a woman with a BMI of 27 may carry more total fat than a man at BMI 27 but face meaningfully lower cardiovascular risk — because of where that fat is located.
Normal-weight obesity
A well-documented phenomenon in women’s health is what clinicians call “normal-weight obesity” — a BMI within the healthy range of 18.5–24.9 combined with a high body fat percentage. Research cited by the University of Rochester Medical Center found that more than half of Americans can have a normal BMI alongside excess body fat. This is more prevalent in women because of the natural higher body fat percentage that comes with female physiology.
If you are within the normal BMI range but carry little visible muscle mass, feel consistently fatigued, or have other metabolic risk factors, measuring your waist circumference gives you a more complete picture than BMI alone.
BMI for Women by Age Group
BMI ranges do not officially change with age for adult women over 20 — the WHO and CDC use the same thresholds across all adult age groups. However, the health implications of a given BMI shift as a woman moves through different life stages.
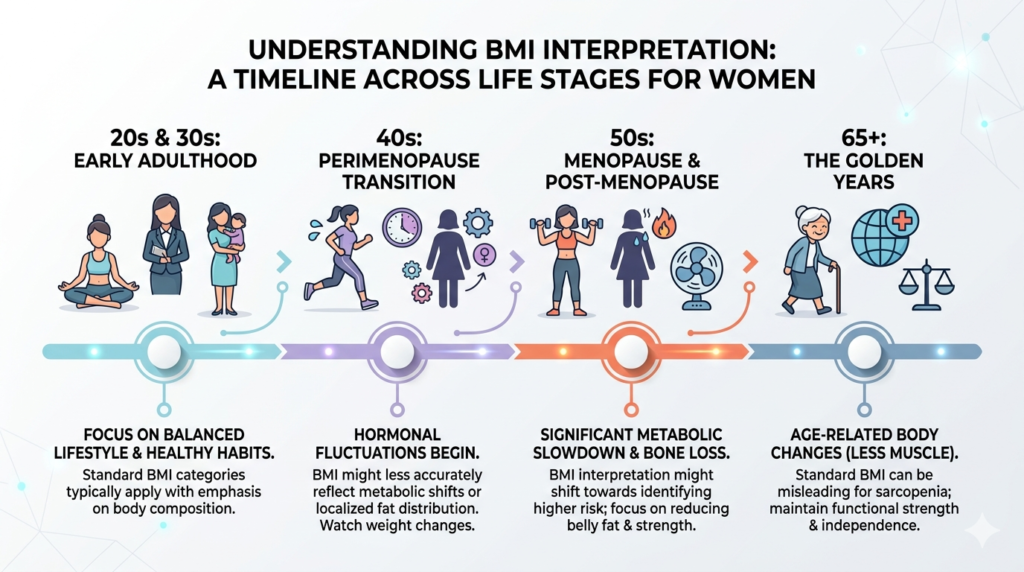
Women in their 20s and 30s
The standard 18.5–24.9 range applies most directly here. A 2025 peer-reviewed study from the Australian Longitudinal Study on Women’s Health — following two cohorts of women aged 18–30 — found that health risks were higher for both underweight and overweight BMI categories compared to normal weight, and that these patterns held across generations. (Dobson, Liang & Mishra, Obesity Journal, 2025)
Pre-pregnancy BMI matters significantly in this age group. Research shows that women with a BMI between 18.5 and 24.9 have optimal fertility rates and the lowest rates of pregnancy complications. Both underweight and obesity are associated with higher rates of conception difficulties and maternal health risks.
Women in their 40s and perimenopausal years
This is where BMI begins to lose accuracy most visibly for women. The hormonal shifts of perimenopause — typically beginning between 40 and 50 — change where fat is stored on the body. As oestrogen declines, fat that was previously directed to the hips and thighs begins redistributing to the abdomen.
A woman can gain visceral abdominal fat during perimenopause without any change in her weight or her BMI. The scale does not move. The BMI calculator shows the same number. But the metabolic risk profile changes meaningfully. A University of Pittsburgh study tracking hundreds of women across 25 years found that accelerated accumulation of abdominal fat during menopause was associated with significantly elevated heart disease risk — even when overall weight remained stable.
For women in this age group, waist circumference is an essential companion to BMI. According to the CDC and NHS, a waist measurement above 35 inches (88 cm) in women indicates elevated cardiovascular risk regardless of what the BMI number shows.
Women over 50 and postmenopause
After menopause, oestrogen production declines sharply. The associated changes in body composition are substantial: research indicates that the onset of menopause is associated with a doubling in the rate of fat mass growth, alongside a decline in lean muscle mass and bone density.
For postmenopausal women, some geriatric research suggests that a BMI in the range of 25–27 may be associated with better health outcomes than a BMI below 25 — because having some additional weight offers a degree of protection against bone loss and the physical frailty that increases fall and fracture risk. Guidance aligned with the Centers for Medicare & Medicaid Services uses a screening range of approximately 23–30 for adults over 65.
This does not mean that being overweight is beneficial after menopause. It means that the precise threshold of 24.9 becomes less important, and that muscle mass, bone density, waist circumference, and functional strength become more meaningful indicators of health than the BMI number alone.
The Limitation Most Women Hit After 40
Here is a situation that plays out in GP surgeries and health checks constantly: a woman in her late 40s or early 50s gets her BMI calculated. It reads 23.5 — comfortably within the healthy range. She is told she is fine. But her waist has noticeably expanded over the past few years, she is carrying more weight around her middle than she ever has before, and her energy and blood sugar levels have shifted.
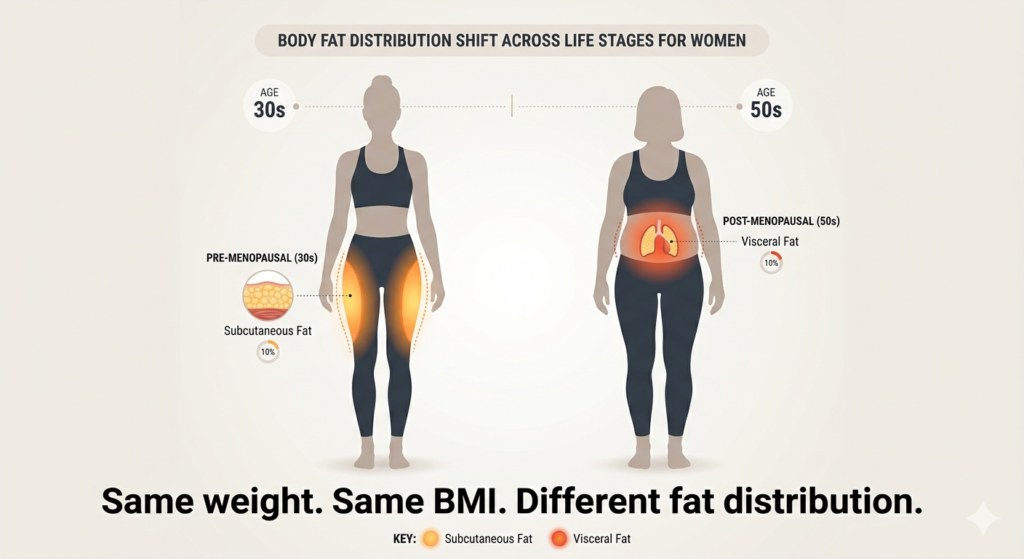
Her BMI is not telling the truth — not because the formula is wrong, but because it cannot see where her fat is sitting.
A 2024 study in the Journal of Clinical Medicine found that BMI was a slightly better predictor of cardiovascular risk in men, while waist circumference was the stronger predictor in women. A 2025 scientific statement from the American College of Cardiology specifically recommends waist circumference as the most clinically useful measure of excess body fat when BMI alone does not capture the full picture.
For women over 40, the combination of BMI plus waist circumference tells a far more complete story than either measure on its own.
| Measure | What It Shows | Limit for Women |
|---|---|---|
| BMI | Total weight relative to height | Under 25 (standard) / Under 23 (Asian descent) |
| Waist circumference | Abdominal fat — visceral risk | Under 35 inches / 88 cm |
If both are within range: low risk.
If BMI is normal but waist exceeds 88 cm: measure the risk more closely — speak with your GP.
If BMI is elevated and waist is also above threshold: the case for action is clear.
What to Do With Your Result
If your BMI is under 18.5 — Underweight
For women specifically, being underweight carries risks beyond the general ones. Low body weight in women is associated with disrupted menstrual cycles, reduced oestrogen, and accelerated bone density loss — increasing the long-term risk of osteoporosis. If you are underweight and also experiencing irregular periods, fatigue, or hair loss, a GP visit and blood panel is a worthwhile first step. A referral to a registered dietitian is also a practical option.
If your BMI is 18.5–24.9 — Healthy Weight
You are in the lowest-risk category. If you are in your 40s or older, add a waist circumference measurement alongside your BMI reading to check whether abdominal fat distribution is shifting. Track your BMI every 3–6 months — the trend over time is more informative than any single reading.
If your BMI is 25–29.9 — Overweight
Research consistently shows that losing 5–10% of body weight produces clinically meaningful improvements in blood pressure, blood glucose, and cholesterol levels for women in this range — even if BMI remains above 25 afterward. The most evidence-backed changes: reducing ultra-processed food intake, adding daily walking, and prioritising sleep quality, which is independently linked to fat accumulation in women.
Also measure your waist. If it is above 88 cm (35 inches), mention this at your next GP visit regardless of your BMI — it is a more actionable indicator of cardiovascular risk in women than the BMI number alone.
If your BMI is 30 or above — Obese
A BMI of 30 or above warrants clinical attention — not because of the label, but because of the accumulated evidence linking it to increased risk of Type 2 diabetes, cardiovascular disease, sleep apnea, and certain hormone-sensitive cancers in women, including endometrial and postmenopausal breast cancer.
The most useful first step is a GP appointment for a baseline health check: blood pressure, HbA1c (blood sugar), and a lipid panel. These three readings tell you far more about your actual health risk than BMI alone. If you are eligible for clinical weight management support — typically at BMI 30+, or BMI 27+ with a weight-related condition — ask about it directly. These programmes exist precisely for this situation and are significantly more effective than self-directed approaches.
A 2025 JAMA Network Open study following nearly 59,000 postmenopausal women over 18.6 years found that intentional weight loss combined with a reduction in waist circumference was associated with significantly lower all-cause mortality, cancer mortality, and cardiovascular mortality. Weight loss that did not also reduce waist circumference showed only limited benefit. The message for women is clear: where the weight comes off matters, not just how much.
Frequently Asked Questions
Is there a different healthy BMI range for women than for men?
No — the formula and the standard thresholds (18.5–24.9 for healthy weight) are the same for both. But women naturally carry 10–20% more body fat than men at the same BMI due to hormonal differences. This means the same BMI number represents a different body composition in a woman versus a man. The thresholds are identical; the biology behind them is not.
Does BMI change during pregnancy?
BMI is not applicable during pregnancy. Weight gain during pregnancy is expected and medically necessary. Healthcare providers use gestational weight gain guidelines specific to pregnancy — not standard BMI thresholds. If you are pregnant and concerned about your weight, speak with your midwife or obstetrician.
Why is my BMI healthy but my waist is getting bigger?
This is a documented pattern in women during perimenopause and menopause. As oestrogen declines, fat redistributes from the hips and thighs toward the abdomen — without necessarily changing your total weight or BMI. You can gain significant visceral fat while your BMI stays the same. A waist measurement above 35 inches (88 cm) is clinically relevant regardless of what your BMI shows.
Does BMI matter differently after menopause?
Yes. After menopause, some research suggests a BMI of 25–27 may be associated with lower mortality risk than a BMI below 25 in older women — likely because it provides some protection against bone loss and frailty. At the same time, visceral abdominal fat becomes more metabolically dangerous after menopause. Waist circumference becomes more important than BMI as the primary health indicator for postmenopausal women.
What is a healthy body fat percentage for women?
Baylor College of Medicine classifies 25–31% as a healthy body fat range for women. Athletes typically fall between 14–20%. Women over 50 naturally carry slightly higher percentages. BMI cannot measure body fat percentage directly — for that, you need a smart scale with BIA (bioelectrical impedance), skinfold caliper measurement, or a DEXA scan.
Can being underweight be harmful for women specifically?
Yes — and more so than it is for men in several specific ways. Low body weight in women is associated with reduced oestrogen, irregular or absent menstrual cycles, reduced fertility, and accelerated bone density loss. Women who are significantly underweight face a higher lifetime risk of osteoporosis and fractures. If your BMI is below 18.5, it is worth discussing with a doctor, especially if you are also experiencing any of the symptoms above.
How often should women check their BMI?
Every 3–6 months is sufficient. More frequent checks are not clinically useful because normal day-to-day weight fluctuations (from hormones, hydration, sodium, and time of day) can shift your BMI by half a point or more without any real change in body composition. Track the trend across months, not the number on a single day. For women in perimenopause, adding a monthly waist measurement is a worthwhile addition.
Related Tools and Guides
- BMI Calculator — Main Page — the full guide to what BMI is, how it is calculated, and what every result means
- BMI Chart — look up your BMI by height and weight without calculating
- Body Fat Calculator — estimate your body fat percentage using the Navy Method, with separate healthy ranges for women
- BMI Calculator by Age — specific guidance for different life stages including teenagers and adults over 65
- BMI Calculator for Men — how BMI works differently for men, including the muscle mass limitation
Sources
- CDC — Adult BMI Categories (June 2024): cdc.gov/bmi
- World Health Organization — BMI Classification and Obesity Classification
- Frontiers in Endocrinology — “The Regulation of Adipose Tissue Health by Estrogens” (2022). DOI: 10.3389/fendo.2022.889923
- Dobson AJ, Liang C, Mishra GD — “Generational differences in associations between health conditions in young women and BMI categories.” Obesity, May 2025. DOI: 10.1002/oby.24304
- Hendryx M et al. — “Intentional Weight Loss, Waist Circumference Reduction, and Mortality Risk Among Postmenopausal Women.” JAMA Network Open, March 2025
- University of Pittsburgh Graduate School of Public Health — “Accelerating gains in abdominal fat during menopause tied to heart disease risk.” Published in Menopause journal, 2021
- ScienceInsights — “What Is a Healthy Waist Circumference for Men and Women” (March 2026), citing Journal of Clinical Medicine 2024 and American College of Cardiology 2025 statement
- Baylor College of Medicine — Healthy body fat percentage guidelines (2024)
Last updated: [5/29/2026] | Reviewed by: [DR TANZEELA]